Scopes
SideScopes provides six desktop scopes, plus Color Picker. Any combination can share the window, one pane per instrument. Use the scope selector to choose and order them, or use the keyboard shortcuts.
The plots analyze only the selected screen region. With no region selected, their graticules and pinned markers remain visible, while traces and live pointer markers are hidden. The pointer readout and Color Picker can still sample a color anywhere on screen.
All levels are derived from the captured desktop pixels. SideScopes does not have access to a source file, timeline, document profile, or signal before the source application renders it. See Measurement boundary before using the scopes for color-managed or signal-compliance decisions.
The browser Lab uses local still images and manual layout controls. HDR and saved layout presets are desktop-only.
Dynamic range
SideScopes starts in SDR. Choose Settings → General → HDR capture to change the whole app. This choice persists across launches; opening a scope does not change it, and presets do not override it.
In HDR, Waveform, RGB Parade and Histogram use one fixed split scale. Encoded SDR levels from 0–100% occupy two thirds of the axis; the remaining third shows +1, +2, +3 and +4 stops above SDR white. Each stop doubles linear light, so +4 is 16 times white. The scale stays fixed as the monitored region moves. Negative components and values beyond +4 stay at the edges. Non-finite measurements are excluded. Either is reported as a reading: the pane’s menu button carries a dot, its tooltip lists each share, and the pane’s menu leads with them. A share held at an edge is information, marked white, since the edge shows it; excluded samples are a warning, marked gold. No scope draws text over its plot. These are counts per displayed bin, not density per equal linear-light interval.
Luma Waveform uses linear luminance in HDR on the same split scale. RGB scopes map each original linear component separately. Zones retains its tonal bands and separate highlight bands, described below. If capture cannot provide HDR data, a warning reading identifies the SDR source and the plots keep the selected HDR scale; they cannot recover clipped highlights.
Vectorscope
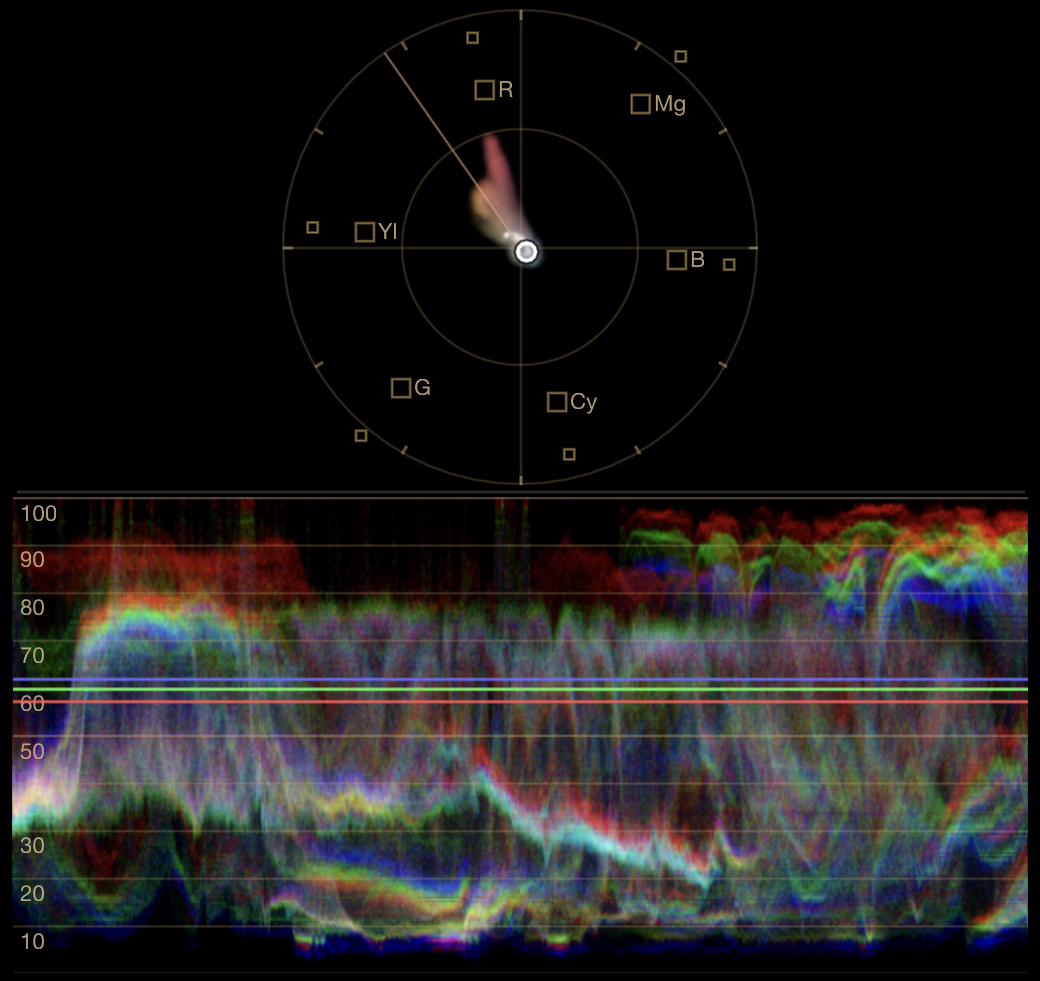
Vectorscope converts each captured RGB sample to two chroma coordinates. Angle around the center corresponds to hue; radial distance corresponds to chroma magnitude in this projection. Equal-channel neutrals lie at the center. Level and image position are discarded, so light and dark samples with the same chroma can occupy the same position.
Trace brightness represents sample density. A strong extension toward a hue usually identifies a population of pixels in that direction. An off-center neutral reference indicates chroma bias; an off-center whole-image trace may instead describe the subject or an intentional grade.
The labeled boxes mark reference positions for 75% Rec.709 color-bar values; the smaller unlabeled boxes mark the full-value positions. They are not gamut boundaries or saturation limits. The skin-tone indicator is a directional reference for comparison, not a target that every complexion should meet.
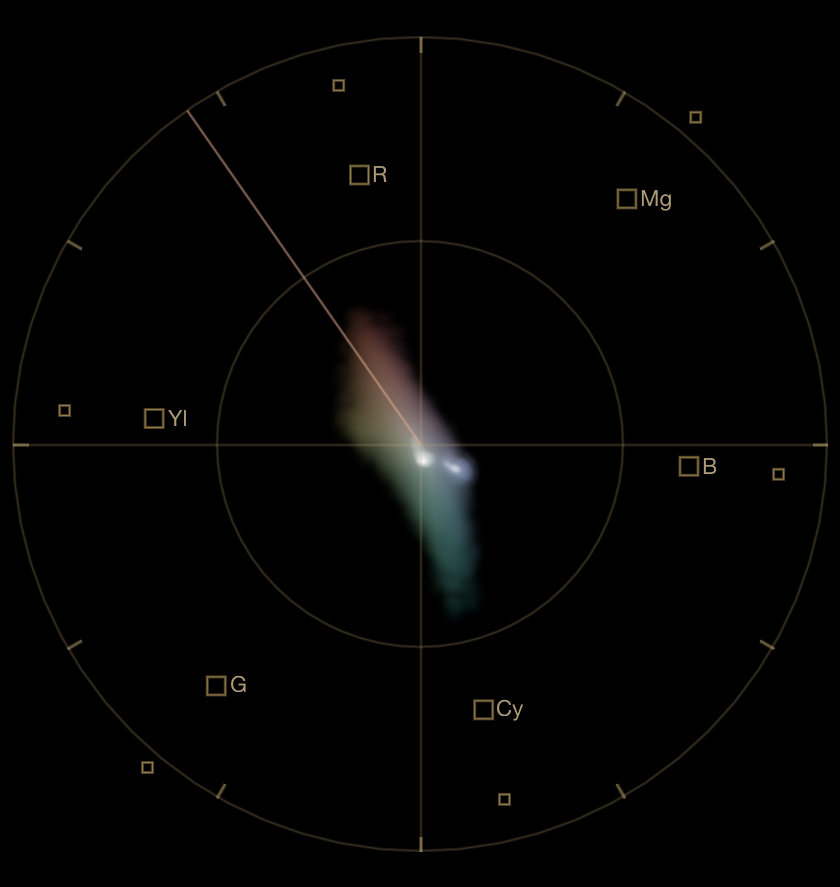
Zoom magnifies the central area at 1x, 2x, or 4x. It changes the view, not the underlying coordinates.
SideScopes uses one fixed, full-range Rec.709-style RGB-to-Cb/Cr matrix. This is most directly interpretable for SDR, sRGB/Rec.709-like rendered output. It does not make Vectorscope a color-managed gamut test.
In HDR, highlights are normalized for this measurement: linear RGB above white is divided by its largest component before sRGB encoding and chroma projection. This preserves the direction of a bright color instead of clipping it toward neutral. Negative components are clipped for this projection and reported as “Below 0”. The brightness itself is measured by the other scopes. Live and pinned markers use this same projection.
Waveform
Waveform overlays red, green, and blue channel levels. Its horizontal axis follows the selected region from left to right; its vertical axis is captured channel code value, normalized from 0 at the bottom to 100 at the top in SDR. This is a full-range display-code scale, not a legal-range video scale. The scale is labeled every 10 where the pane gives each row room for its number; a compact pane keeps 100 and 50. The bottom edge is 0 and carries no label.
Each sampled pixel contributes at its actual channel level. A vertical slice therefore shows the values present in the corresponding image column; the scope does not fill every value between the lowest and highest samples.
Trace brightness uses a fixed response to sample density, adjusted by the intensity control. Bright or dark areas entering the region do not reset a frame-wide brightness ceiling. Banding correction still uses statistics from the whole region and can change individual traces as its content changes.
Channel separation is meaningful in context. Over a verified neutral, it can show a rendered color bias and the tonal range in which that bias occurs. Over a colored subject, the same separation may simply describe the subject.
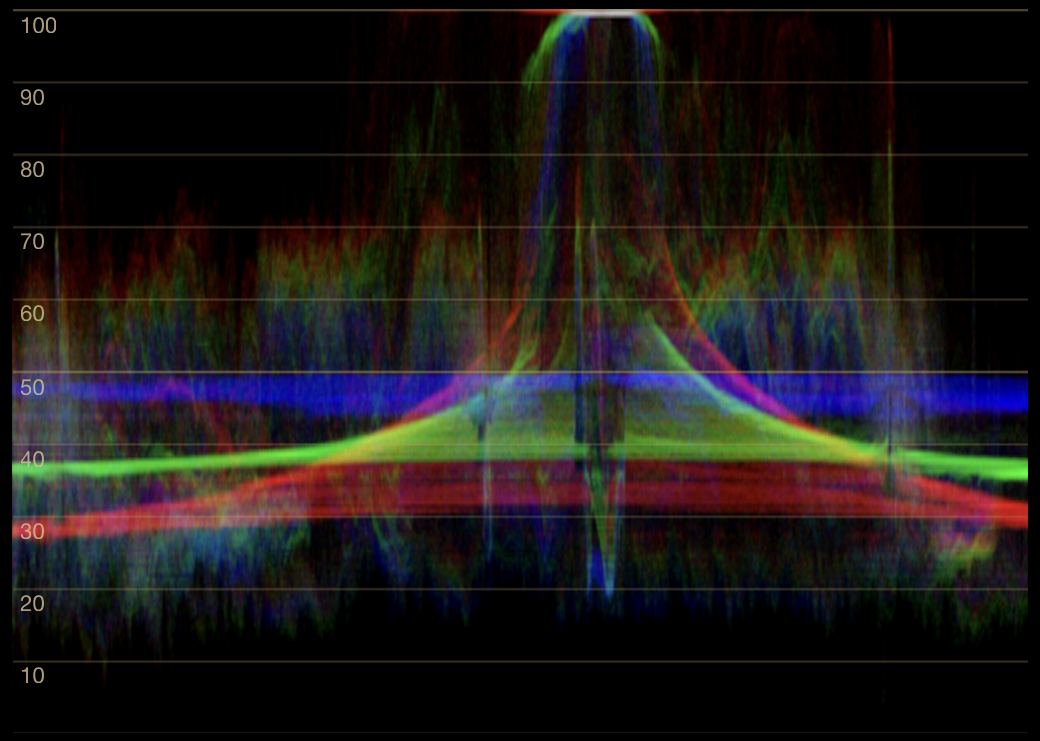
A strong accumulation at 0 or 100 means captured output pixels reached that endpoint. It may be consistent with clipping or crushing in the rendered output, but does not identify the limiting stage or prove that a RAW file, timeline, or source signal has no recoverable detail.
Luma Waveform
Luma Waveform retains the waveform’s horizontal image position and plots a single weighted level in SDR:
Y′ ≈ 0.2126 R′ + 0.7152 G′ + 0.0722 B′
The SDR calculation uses the encoded captured channel values. Y′ is not physical luminance, scene brightness, or a direct exposure measurement. It is useful for locating and comparing level distributions in the rendered output.
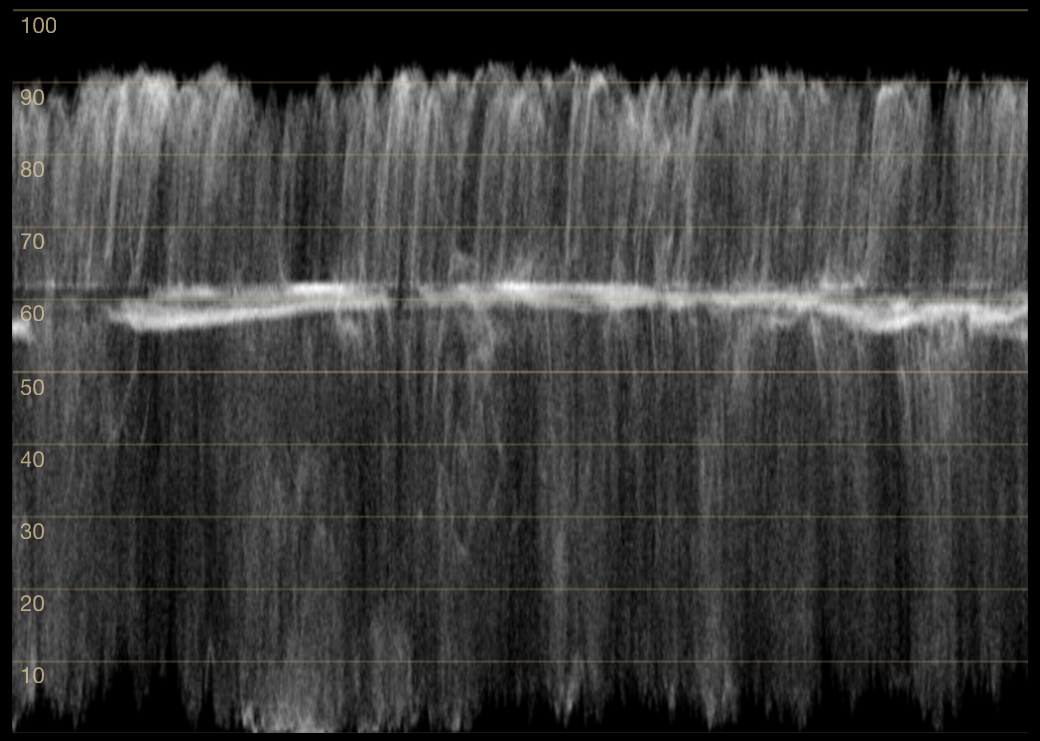
Plain draws a neutral trace. Colored tints the trace from the captured RGB contributions while keeping the same luma coordinate.
Zones
Zones shows what percentage of the selected region occupies each tonal band. Unlike a waveform, it discards horizontal image position. The fixed 0–100% amount scale makes readings comparable while moving a small region across a photo. Every pixel counts; earlier regions are not blended into the reading.
The scale follows the Zone System’s familiar 0–X notation: black through middle gray (V) to white. These eleven labels describe rendered tones, using CIE L* bands centered at 0, 10, …, 100. Boundaries are halfway between centers; a boundary belongs to the lighter band. SDR luminance is calculated from linearized sRGB, including native ten-bit capture precision. This is a digital tonal-placement aid inspired by the Zone System, not a measurement of the original scene’s exposure or a reconstruction of film development. Neighboring zones on this rendered-lightness scale are not one-stop exposure intervals. Zone 0 and X include near-black and near-white tones; they do not by themselves mean the image is clipped.
The percentage graticule adds 25% and 75% when the axis has enough room for readable labels; compact panels retain 0%, 50% and 100%. Zone labels switch as a group: when the full set cannot fit, only 0, V and X remain, plus the final >+4 band in HDR. Hovering still identifies every band. The grid and its labels use the same gold graticule ink as the other scopes and follow the graticule strength; the middle-gray label V is drawn at full ink.
Auto orientation follows the panel’s aspect ratio: dark-to-light runs left to right in a wide panel and bottom to top in a tall one. Choose Auto, Horizontal or Vertical under Orientation in the pane’s menu. Orientation is saved with the current layout preset when the layout is saved. Hover a band for its name and exact share. The distribution updates as you scan another area.
A thin gold live-cursor line places the sampled tone continuously within the bands. In a wide panel it moves left to right; in a tall panel it moves up and down. The line stays within the plot and locates the sampled tone, independently of each bar’s percentage. It follows the shared cursor-marker visibility control and the histogram/vectorscope smoothing setting, without adding a separate mode or control.
The sample averages luminance in the cursor’s small neighborhood before placing it on the scale. HDR uses the original unclipped luminance where the capture provides it, joining SDR white continuously to the highlight bands. Beyond +4 stops, the line stays at the boundary of the open-ended >+4 band. Outside the captured HDR region, the ordinary screen sample provides only SDR placement.
HDR tonal bands
SideScopes starts in SDR. Only the app-wide HDR capture setting in Settings requests HDR capture; opening or closing a scope never changes it. The choice is retained across launches, separately from layout presets. In HDR, Zones keeps 0–X through SDR white and adds amber bands up to +1, +2, +3 and +4 stops above white, plus an overflow band beyond +4. The first band includes values greater than white through twice white; the next includes values greater than twice through four times white, and so on. All bands share one denominator. Invalid luminance samples are excluded, and an unsupported capture falls back to SDR tones; either is reported as a warning reading in the pane’s menu.
On Apple Silicon with macOS 15 or later, HDR capture uses validated local Display P3 PQ with a nominal 100-nit reference. Windows scRGB uses the display’s current SDR content brightness. These readings describe the captured desktop, not emitted panel brightness or recoverable detail in the original file. Application rendering, display settings and tone mapping can affect them. The pointer readout and Color Picker retain signed channel values, including values above 100%, while HDR is enabled.
RGB Parade
RGB Parade places the three channel waveforms side by side: red, green, then blue. Each panel maps the full width of the selected region. The image is not divided into thirds.
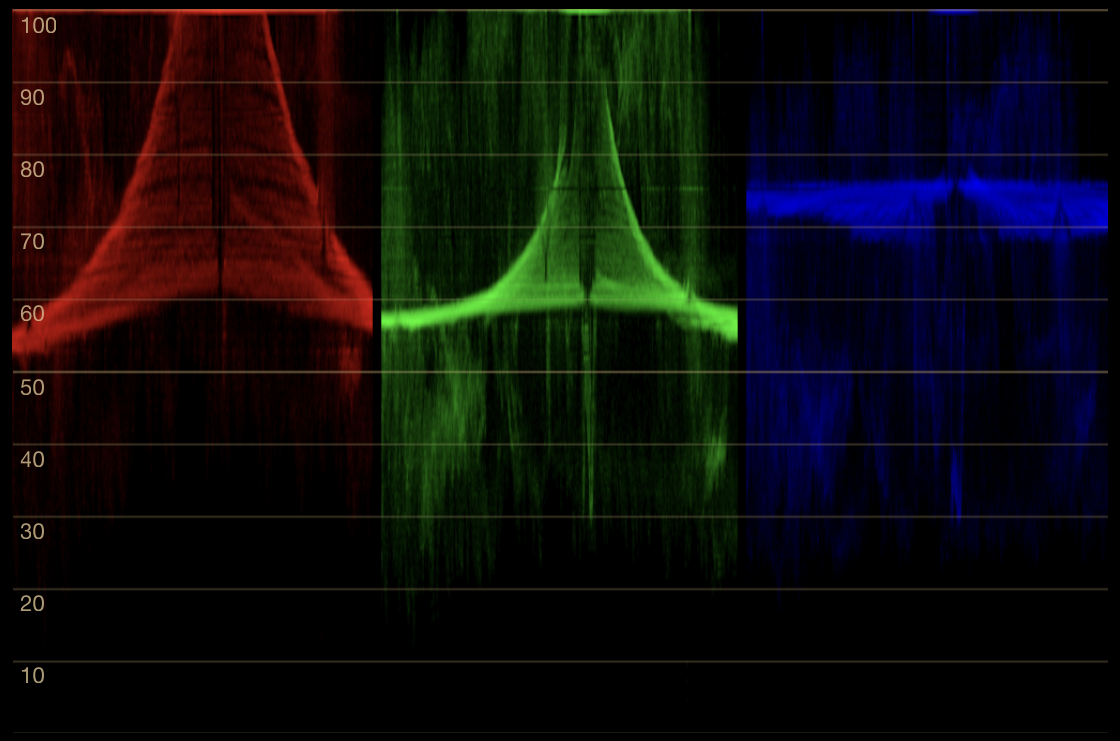
The separate panels prevent overlapping traces from hiding one another. This makes channel shape, level, and endpoint behavior easier to compare. As with Waveform, alignment indicates neutrality only for a subject that is independently expected to be neutral.
Histogram
Histogram counts how many sampled red, green, and blue values fall into each of 256 bins. Minimum channel values are at the left and maximum values at the right. It discards image position.
Per Channel places the complete red, green, and blue distributions in separate vertical bands. Combined overlays them at full height. The displayed heights use a square-root response so a large population does not hide smaller ones; height is therefore not linearly proportional to count.
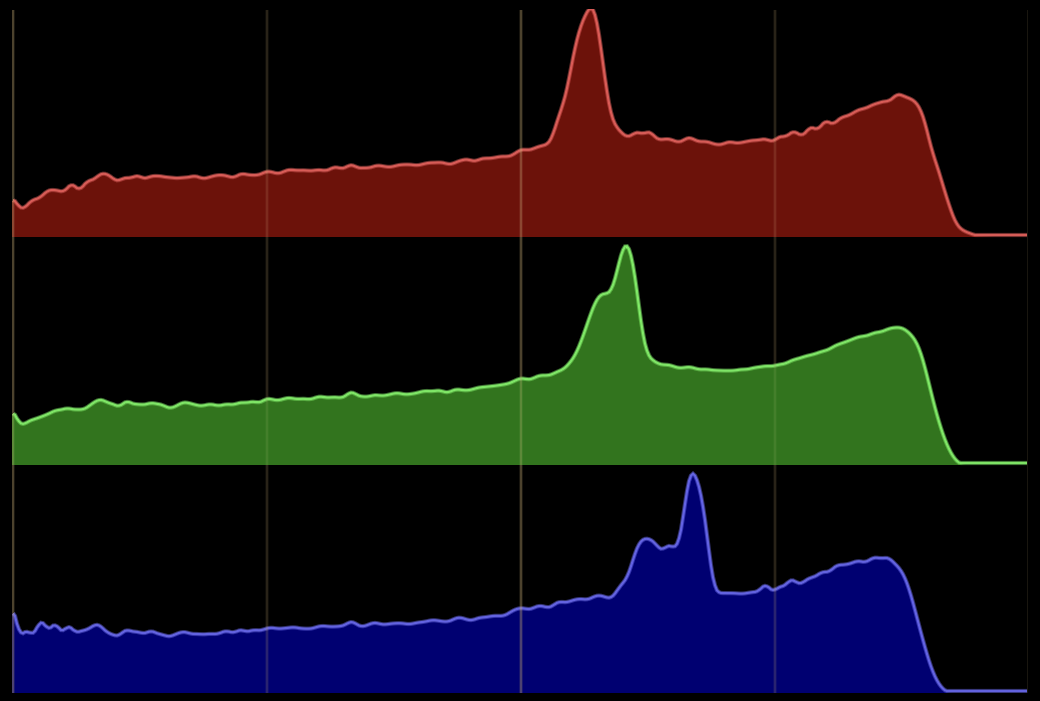
A peak identifies a large population at that code value. A gap identifies few or no sampled values in an interval. Neither proves a particular processing fault: gaps do not by themselves establish visible posterization, and endpoint peaks do not identify where limiting occurred.
Color Picker
Color Picker places the live sample beside pinned references. It reports captured RGB values and, when a reference is selected, an assumed-sRGB color difference.
The live sample follows changes beneath a stationary pointer, including outside the monitored region. Screen reads outside the capture are throttled to eight per second and do not overlap.
Click to pin the color under the pointer. Drag to pin the average of a rectangle, which is generally more repeatable for textured or noisy material. Hold Shift to keep the pin tool active for additional samples.
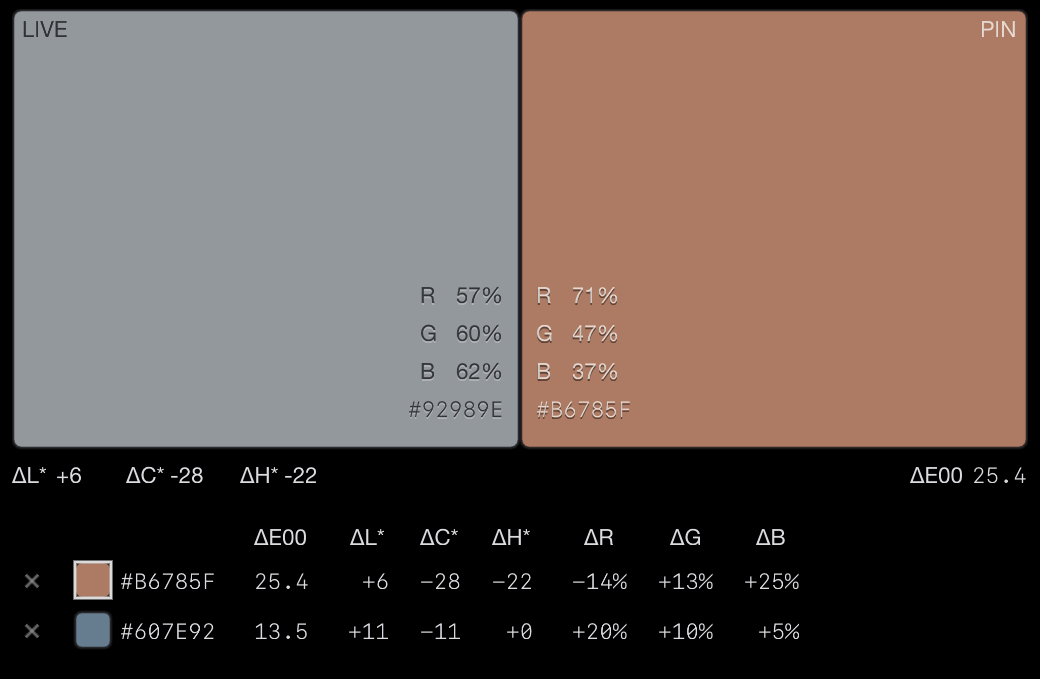
For bounded SDR samples, SideScopes converts the reference and live samples from assumed sRGB to CIELAB under D65. It reports CIEDE2000 ΔE00 and three signed diagnostics:
- ΔL*, the CIELAB lightness difference;
- ΔC*, the CIELAB chroma difference;
- ΔH*, a chroma-weighted hue-difference term.
The components do not correspond one-to-one with exposure, saturation, or white-balance controls, and the ΔE00 total is not their simple sum. There is no universal acceptable ΔE00 threshold; the relevant tolerance depends on the colors, sample area, viewing conditions, and task.
Markers and pins
The color under the pointer is marked on every visible compatible scope: its chroma position in Vectorscope, channel or luma level in Waveform, Luma Waveform, and RGB Parade, and bin in Histogram. Live markers appear while a region is selected and can follow colors anywhere on screen. Pinned markers remain visible without an analysis region.
HDR samples keep signed, unclipped color and their nominal white reference
when pinned or saved. Swatches and HEX are explicitly SDR previews; clicking
an HDR reference copies color(srgb-linear …) instead. Its menu also offers
Copy SDR HEX preview. A tooltip gives the extended RGB percentages and
nominal encoding white, which is not measured panel brightness.
Comparisons involving HDR use Δ stops, the luminance ratio of live to reference, and ΔR/ΔG/ΔB in percentage points. Each sample is relative to its own nominal white. Zero or negative luminance has no defined stop ratio and shows a dash. This comparison never substitutes a clipped SDR ΔE00 for HDR brightness. HDR region pins average linear light before encoding the readout.
Pinned colors appear in Vectorscope and Color Picker. Pins persist between sessions and can be selected as comparison references.
To hide the live pointer markers, quit SideScopes and set
show_cursor_markers=0 in preferences.conf. The default is 1. This does
not hide the status-bar RGB readout or pinned markers.
Trace controls
Hover a scope pane to show its menu button in the pane’s top-right corner. The menu holds that instrument’s own options: its style or orientation, its trace intensity, Vectorscope zoom, and pins for the scopes that take them. Reset restores those options, and Hide takes the pane off-screen. Settings that apply to every scope stay in Settings and the context menu. A dot on the button means the scope has readings, white for information and gold when any is a warning; the button’s tooltip names the scope and lists them, and the menu leads with them. Escape closes an open menu before it does anything else.
Right-click a scope pane to reach that instrument’s options in the context menu. Right-click elsewhere to open the complete menu.
Graticule strength changes the opacity of grid lines, rings, target boxes, and labels. The choices are Faint, Soft, Normal, and Bold.
Zoom changes Vectorscope magnification between 1x, 2x, and 4x. Above 1x, the level is shown in the pane’s top-left corner, level with the menu button.
Style selects Plain or Colored for Luma Waveform, and Per Channel or Combined for Histogram.
Settings → General → Analysis quality sets capture cadence and analysis detail. Standard, the default, targets 15 captures per second. High targets 20, retains full detail while a region is dragged, and uses finer analysis for Vectorscope and Histogram panes where their size benefits from it. High uses more processing time.
Scope Controls opens from the main window’s right-click menu. Settings contains global preferences and shortcuts. Waveform and RGB Parade share one set of trace controls because they render the same channel measurement in different arrangements.
Intensity controls how much each sample contributes before the rendered trace saturates. Scroll over Vectorscope or Waveform, or use the slider in the scope’s menu, to change it; double-click the scope to restore the default. It changes visibility, not coordinates.
Sampling stride samples every Nth pixel, from 1 through 8. A stride of 1 includes every pixel. Larger strides reduce analysis cost and may make sparse or highly regular content less exact.
Smoothing controls how long the pointer marker takes to settle after the sample changes, from 0 to 500 milliseconds. It affects the marker, not the scope trace.
Trace gamma, available for Vectorscope, changes the density response used to display the trace. Lower values reveal sparse populations more strongly; higher values preserve greater contrast against the densest areas. The range is 0.40 to 1.40.
Arranging panes
Scopes divide the window in the order shown in the scope selector; drag rows there to reorder them. The order belongs to the active preset. Turning a scope off and on does not move it within that order.
The Layout menu controls the division axis. Automatic uses the longer window axis; Vertical (stacked) and Horizontal (side by side) force an orientation. Panes are separated by an empty black gap. Pointing at the gap outlines the two panes it divides; drag it to change their shares.
Nine preset slots store scope visibility, order, division, pane weights, and per-scope style. A digit loads its slot. Use the preset list to load or rename slots.
Changing the current arrangement does not overwrite its slot. The toolbar save button lights while the arrangement differs from the loaded preset. Click it, or press Command+S on macOS or Control+S on Windows, to update that slot. Shift+1 through Shift+9 writes the current arrangement to another slot without loading it.
The current working arrangement persists separately, including when it has not been saved to a preset. Loading another slot intentionally replaces that working arrangement without a confirmation prompt.
Trace intensity, sampling, smoothing, trace gamma, window position, and window size are not part of a layout preset.
Measurement boundary
SideScopes receives the composited screen-capture result. The desktop capture is requested or converted to sRGB where the platform API permits. The ordinary SDR scope calculations treat the resulting codes as full-range, sRGB/Rec.709-like output. HDR scopes use the separate unclipped linear RGB and luminance planes.
On Windows with HDR or Automatically manage color for apps enabled, the desktop is composited in linear scRGB. SideScopes reads it in that form, divides by the SDR content brightness, and encodes the result as 10-bit sRGB codes. This removes the desktop’s SDR white boost; it does not guarantee identical pixels when application rendering or desktop composition changes. In SDR mode, above-white content reads at 100% and colors outside sRGB read at its boundary. In HDR mode, unclipped color is retained inside the captured region. On Mac, sampling outside that region remains SDR and cannot report highlights above white. If the display’s SDR brightness cannot be read, capture recovers before publishing normalized values. Diagnostic recordings count pixels with any channel strictly above SDR white; exact white is excluded. That count differs from the luminance-based highlight bands in Zones.
SideScopes does not inspect the source profile, timeline color space, display ICC calibration, printer profile, source HDR mastering metadata, or upstream signal range. It is not a soft-proofing system, HDR reference monitor, gamut checker, or source-signal compliance scope. Use the source application’s own configured scopes when those stages matter.